Scroll Phone Down
to Find Content
Table of Contents
About
Forward
Introduction
Key drowning facts
Drowning statistics 2016-2021
Strategy Framework
Priorities
Action levels
CA-WSS Priorities
Using the CA-WSS
Priority 1: Public significance
Priority 2: Data
Priority 3: Everyone a swimmer
Priority 4: Safe at all ages
Priority 5: Pools
Priority 6: Open water
Priority 7 Lifeguards
Priority 8: Water Emergency
Preparedness
Next steps
Acknowledgements
References
Water Safety Strategy
Section 01
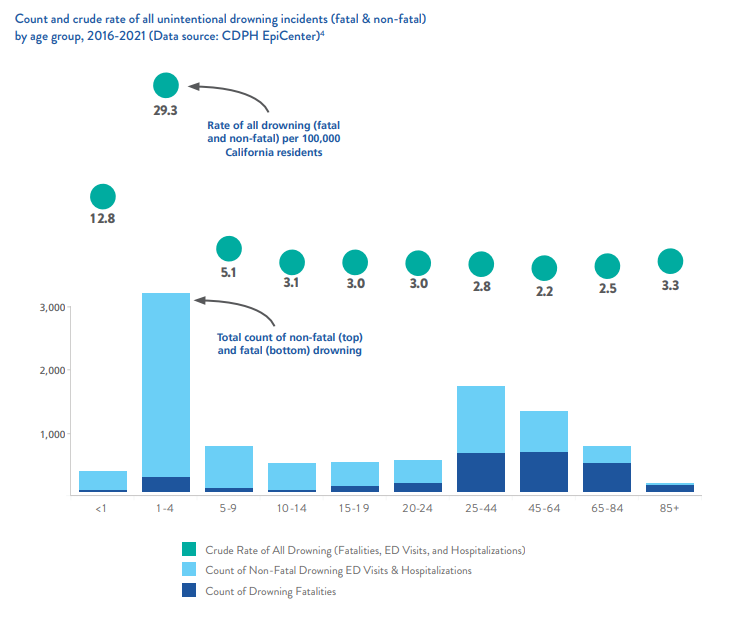
Count and crude rate of all unintentional drowning incidents (fatal & non-fatal) by age group, 2016-2021 (Data source: CDPH EpiCenter)4 21* (Data source: CDPH EpiCenter)(4)
Unintentional fatal drowning counts and crude death rates per 100,000 California residents by age group, 2016 - 2021 (Data source: CDPH EpiCenter) (4)
Understanding what is counted - The full burden of drowning
The traditional approach used to count and report on drowning typically focuses on deaths only (not non-fatal events), and excludes drowning deaths due to boating and other water-transport, disaster events (e.g., floods), intentional drowning (e.g., suicide, homicide), drowning of undetermined intent, and deaths where drowning is listed as a contributing cause (i.e. not the primary cause of death). A preliminary analysis of fatal drowning based on 2005-2019 data from the California Comprehensive Master Death File found that the traditional approach severely underrepresented the number of drowning deaths, capturing only 67.5% of all drowning cases. (5) When taking all fatal drowning cases into account, more than 600 drowning deaths occur per year in California.
A restricted view of the problem limits understanding of the issue and influences which populations and places are prioritized for intervention. Additionally, it creates artificial boundaries and silos within the issue, which may impact prevention. Broader criteria of which fatal and non-fatal cases are counted and included in analysis and reports is imperative to characterizing the full burden of drowning in California, and an important component of Priority 2 .
